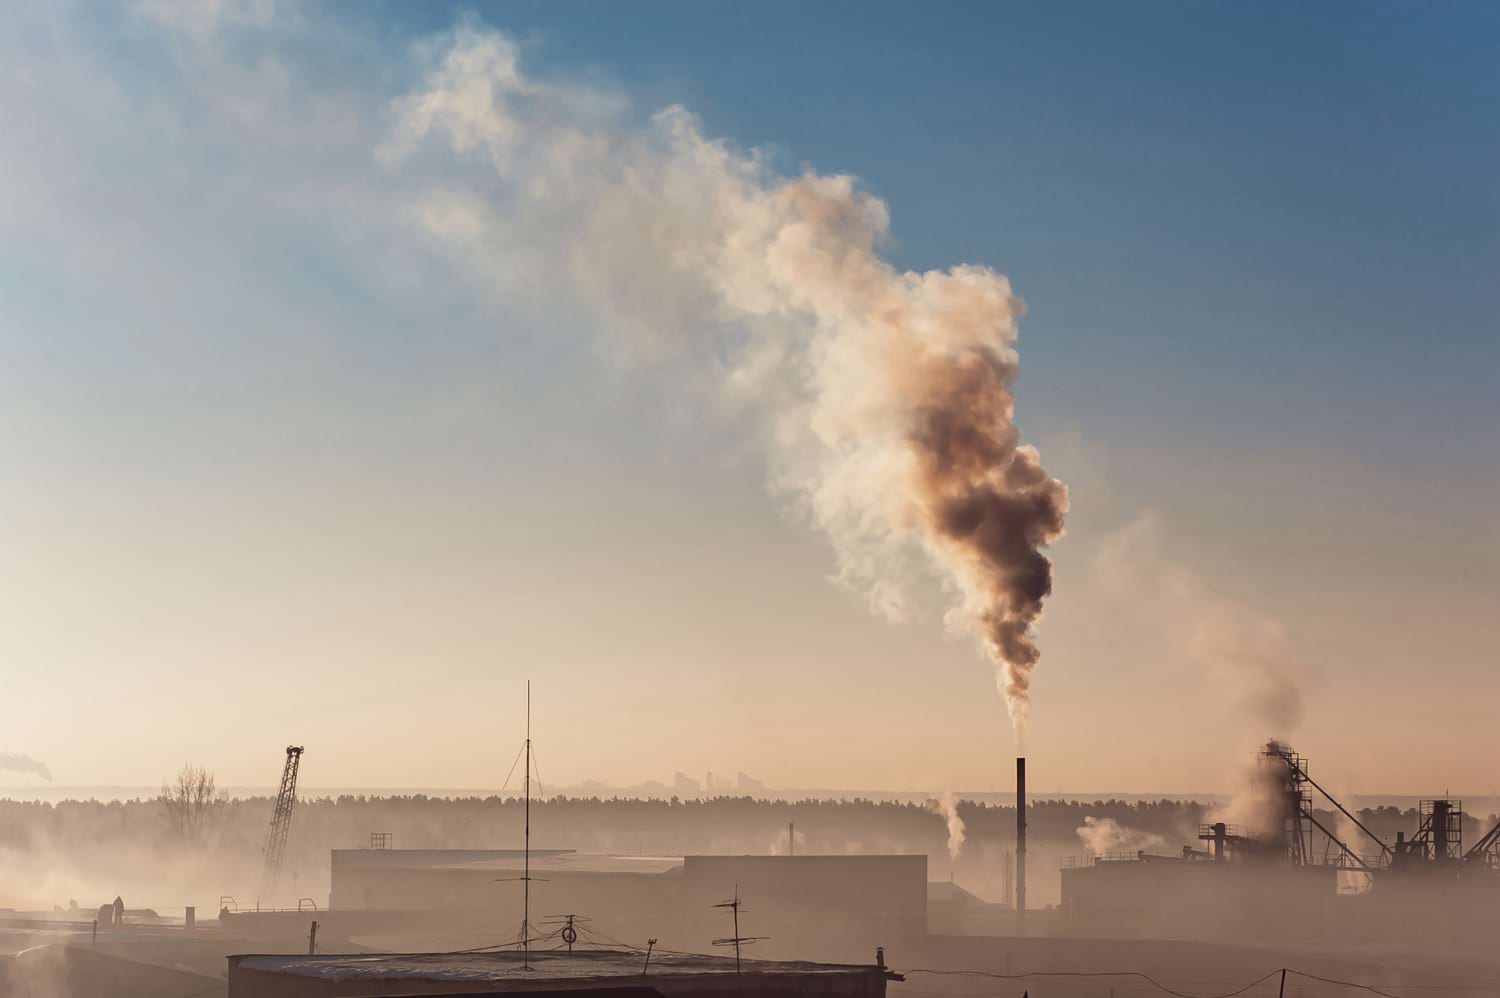
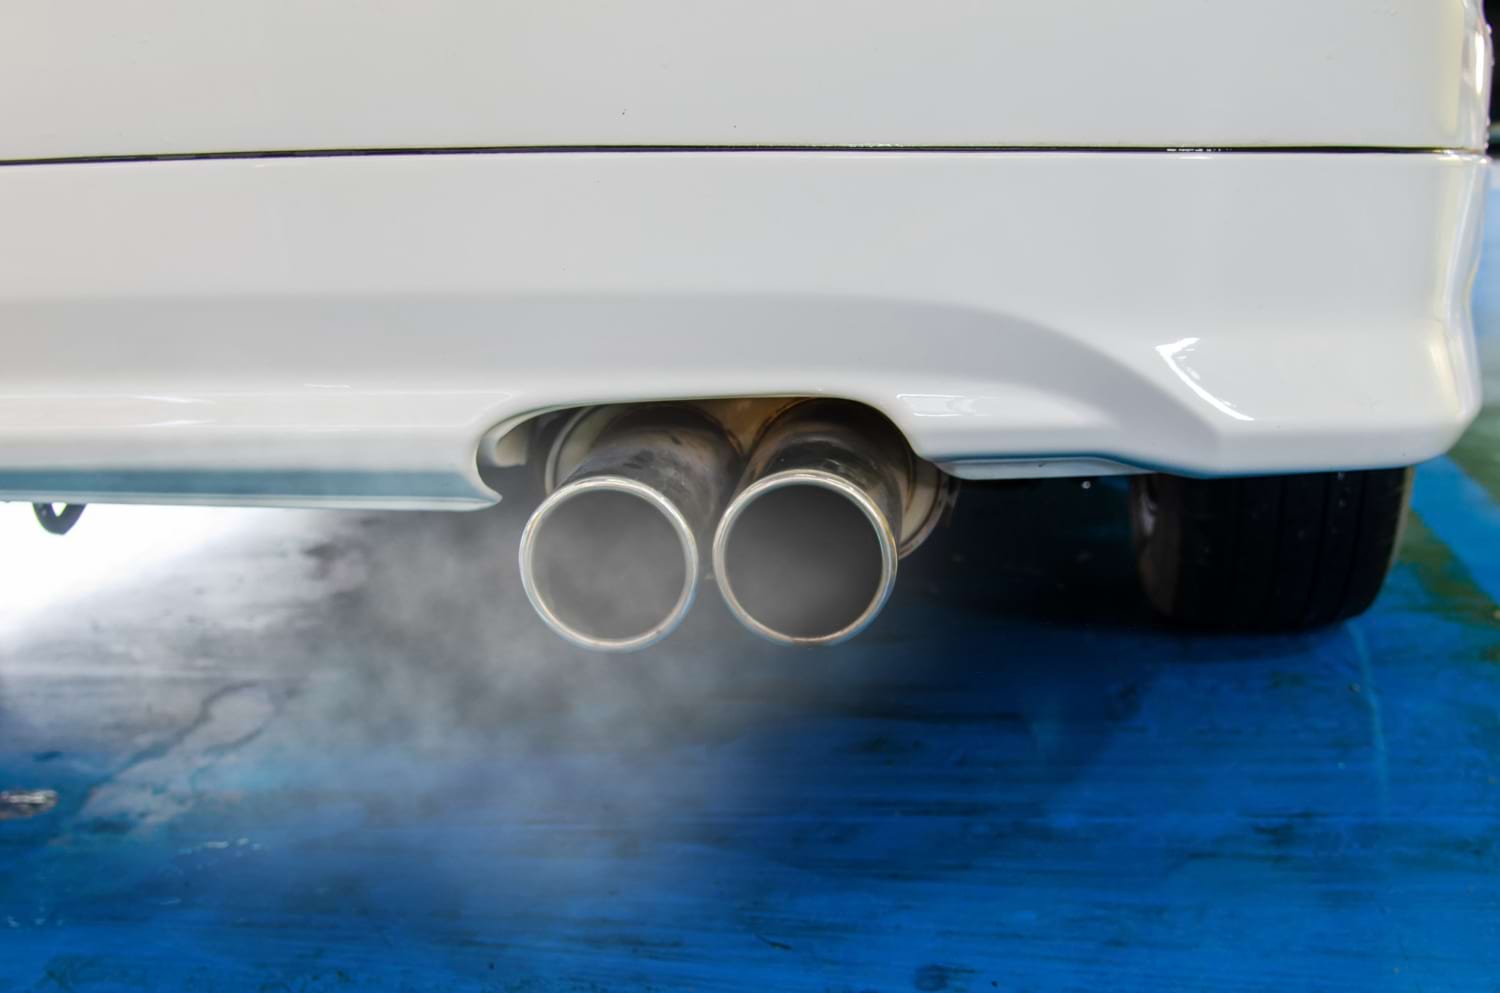
Air pollution has become one of the most persistent environmental challenges affecting both urban and rural communities. It arises when harmful substances enter the atmosphere as a result of natural processes or human activities such as transportation, industry, energy production, and agriculture. These pollutants can travel long distances, accumulate in densely populated regions, and contribute to respiratory illnesses, cardiovascular problems, and environmental degradation.
A modern air quality map helps illustrate the geographic distribution of these pollutants, providing an accessible visual tool that shows how contamination varies across regions. This type of monitoring helps researchers, policymakers, and residents better understand where air pollution comes from and why it intensifies under specific conditions. As technology advances, the precision and availability of these measurements continue to improve, offering more actionable insights into the factors that contribute to poor atmospheric conditions.
How Air Pollution Is Measured Using Modern Technologies
Measuring air pollution relies on a combination of stationary monitoring stations, mobile detectors, satellite imagery, and an extensive network of low-cost sensors placed in many locations. Traditional monitoring stations use highly accurate instruments such as gas analyzers, beta attenuation monitors, and optical particle counters to detect concentrations of particulate matter, nitrogen dioxide, sulfur dioxide, ozone, and carbon monoxide. Meanwhile, compact sensors installed on buildings, lampposts, or even personal devices capture localized data that complements official measurements. With information continuously uploaded to shared databases, a detailed air quality map can be generated in real time. This map enables scientists to track pollution spikes, compare emission levels between areas, and identify correlations with weather patterns or traffic density. The integration of multiple data sources ensures that the measurement process becomes more comprehensive, more dynamic, and significantly more reflective of actual life conditions in specific neighborhoods.
Types of Pollutants Commonly Found in the Atmosphere
Air pollution includes a wide variety of chemical compounds and particulate substances, each with distinct effects on human health and the environment. One of the most frequently monitored categories is particulate matter—PM2.5 and PM10—tiny particles that can penetrate deep into the respiratory system and even enter the bloodstream. Gaseous pollutants such as nitrogen dioxide, ozone, sulfur dioxide, and carbon monoxide also contribute to poor air quality, especially in regions with heavy transportation or industrial activity. Volatile organic compounds and toxic metals, including benzene and lead, add further complexity to the pollution mix. By representing these substances visually, a modern air quality map helps people understand which pollutants dominate in their region and how their levels change over time. When such information is widely accessible, communities can respond more effectively by limiting outdoor activity during peak pollution hours or advocating for cleaner local energy solutions.
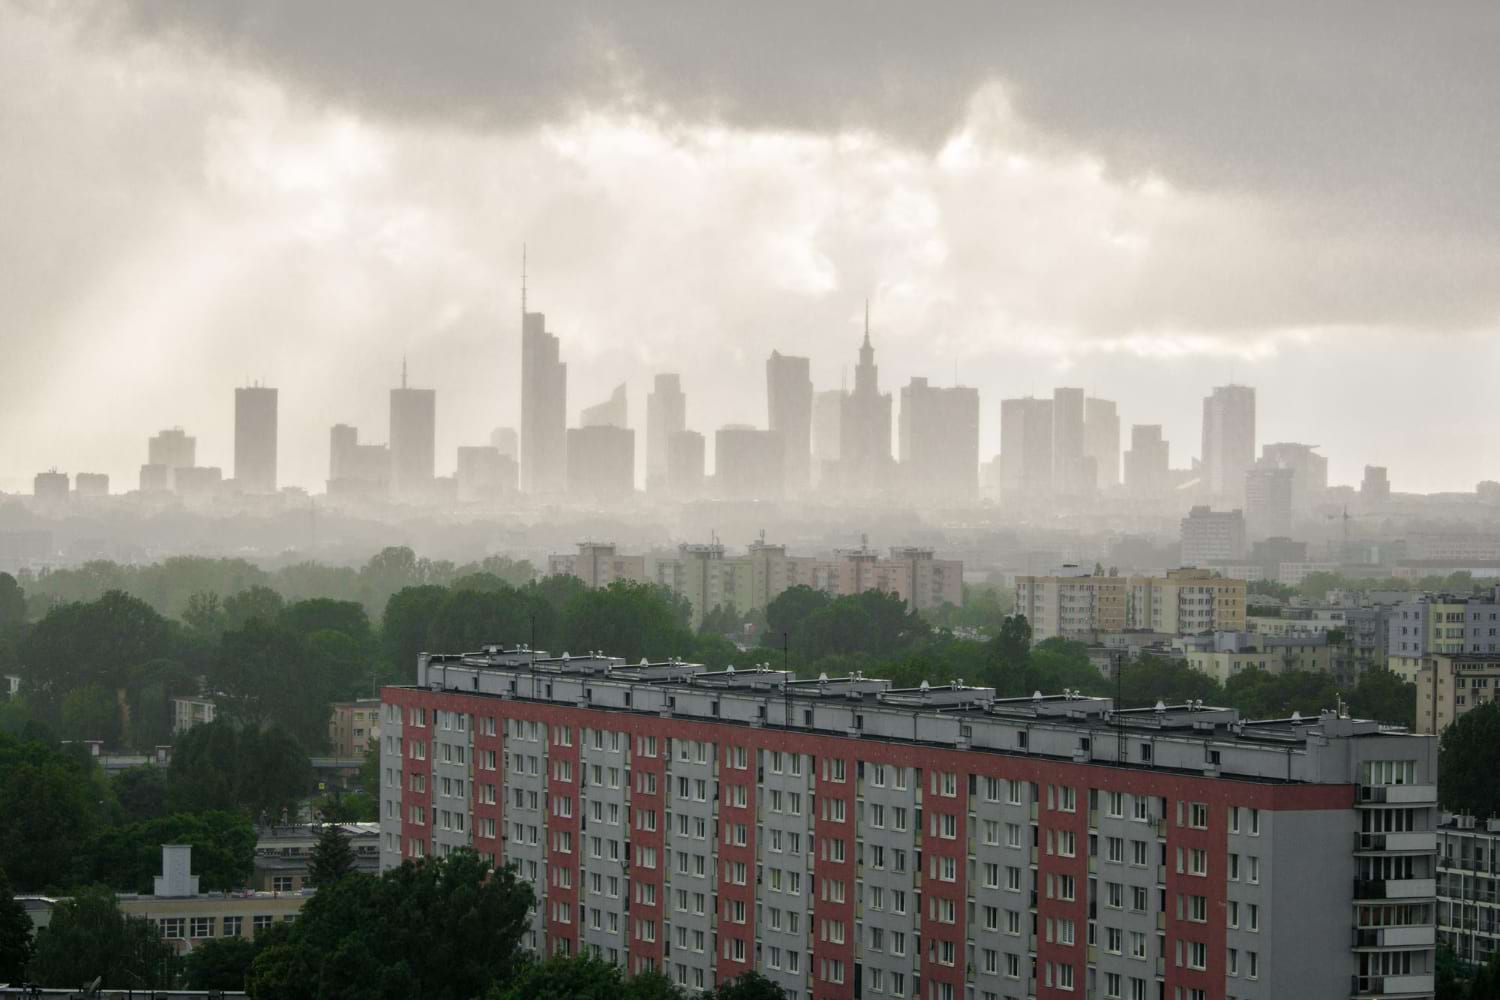
What Is Smog and How It Affects Urban Environments
Smog is a dense, often hazy mixture of pollutants that forms when emissions interact with atmospheric conditions such as humidity, temperature inversions, or strong sunlight. There are two main types: classical smog associated with coal combustion, and photochemical smog linked to nitrogen oxides reacting with sunlight, commonly seen in warm, traffic-heavy cities. Smog reduces visibility, irritates the throat and eyes, worsens respiratory diseases, and can significantly degrade overall quality of life. Fragile groups such as children, the elderly, and individuals with chronic health issues feel its effects most strongly. Contemporary monitoring tools, including the ever-evolving air quality map, make it easier to detect smog formation as it develops. Visualizing smog intensity across regions helps authorities issue warnings, plan traffic restrictions, or implement temporary emission control measures. As more data becomes available through widespread sensor networks, the ability to forecast and mitigate smog events becomes more reliable.
How Multiple Sensors Create a Real-Time Air Quality Overview
The widespread distribution of low-cost air quality sensors allows continuous monitoring across cities, suburbs, and industrial zones. These devices communicate with central servers, sending detailed reports on pollutant levels multiple times per hour. Combined with satellite observations and professional measurement stations, this network helps build a nuanced representation of atmospheric conditions. As a result, the air quality map has evolved from a simple visualization into a powerful analytical tool. It serves as an early-warning system, an educational resource, and a foundation for long-term environmental policies. Through this integration of technology and environmental science, communities worldwide gain the ability to better protect public health, reduce emissions, and promote cleaner living spaces.